
When I was growing up, I loved Choose Your Own Adventure books. I see the world in shades of gray instead of black-and-white, so I was immediately drawn to the seemingly endless scenarios that the main characters could experience as I made different choices for them.
As investors, we often get so caught up in one particular market narrative that we are unable to think “outside the box” and consider other possible outcomes. Successful investors I’ve worked with have been exceptionally good at looking at all the possibilities, challenging their own investment thesis by opening themselves up to other options.
Today, we’ll walk through four potential outcomes for the S&P 500 index over the next six to eight weeks. As I share each of these four future paths, I’ll describe the market conditions that would likely be involved, and I’ll also share my estimated probability for each scenario.
By the way, we ran through four scenarios for the S&P 500 back in July, and you may be surprised to see which scenario actually played out!
And remember, the point of this exercise is threefold:
- Consider all four potential future paths for the index, think about what would cause each scenario to unfold in terms of the macro drivers, and review what signals/patterns/indicators would confirm the scenario.
- Decide which scenario you feel is most likely, and why you think that’s the case. Don’t forget to drop a comment and let me know your vote and what you think will cause that scenario to play out.
- Think about how each of the four scenarios would impact your current portfolio. How would you manage risk in each case? How and when would you take action to adapt to this new reality?
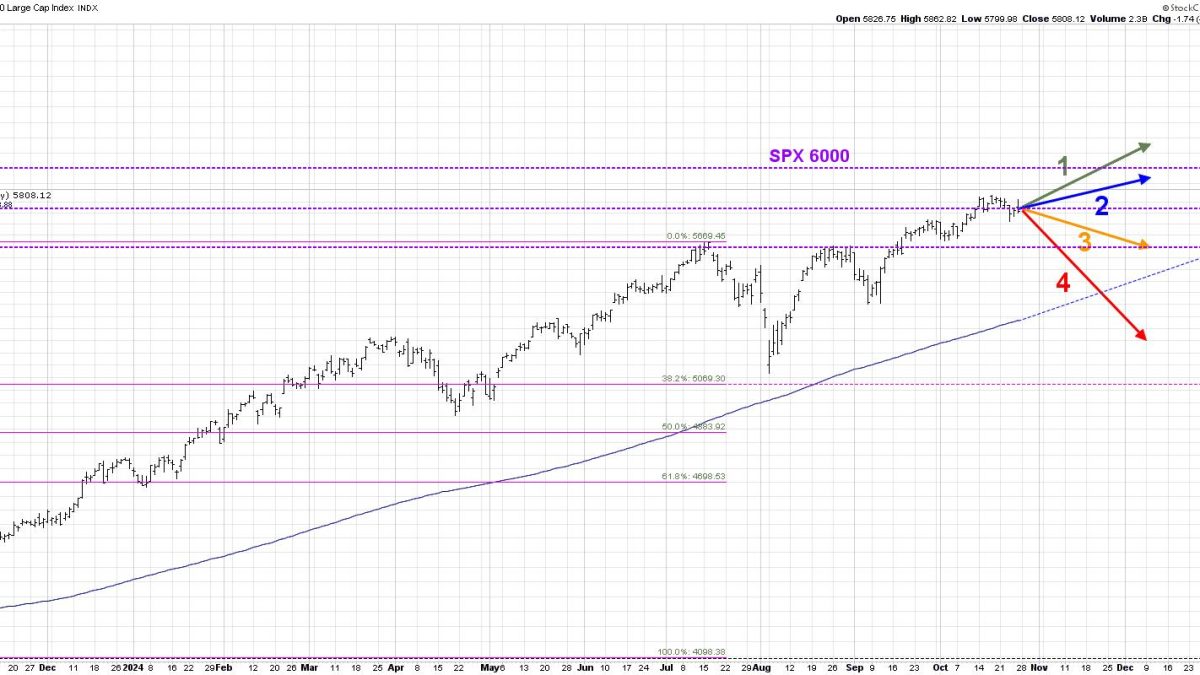
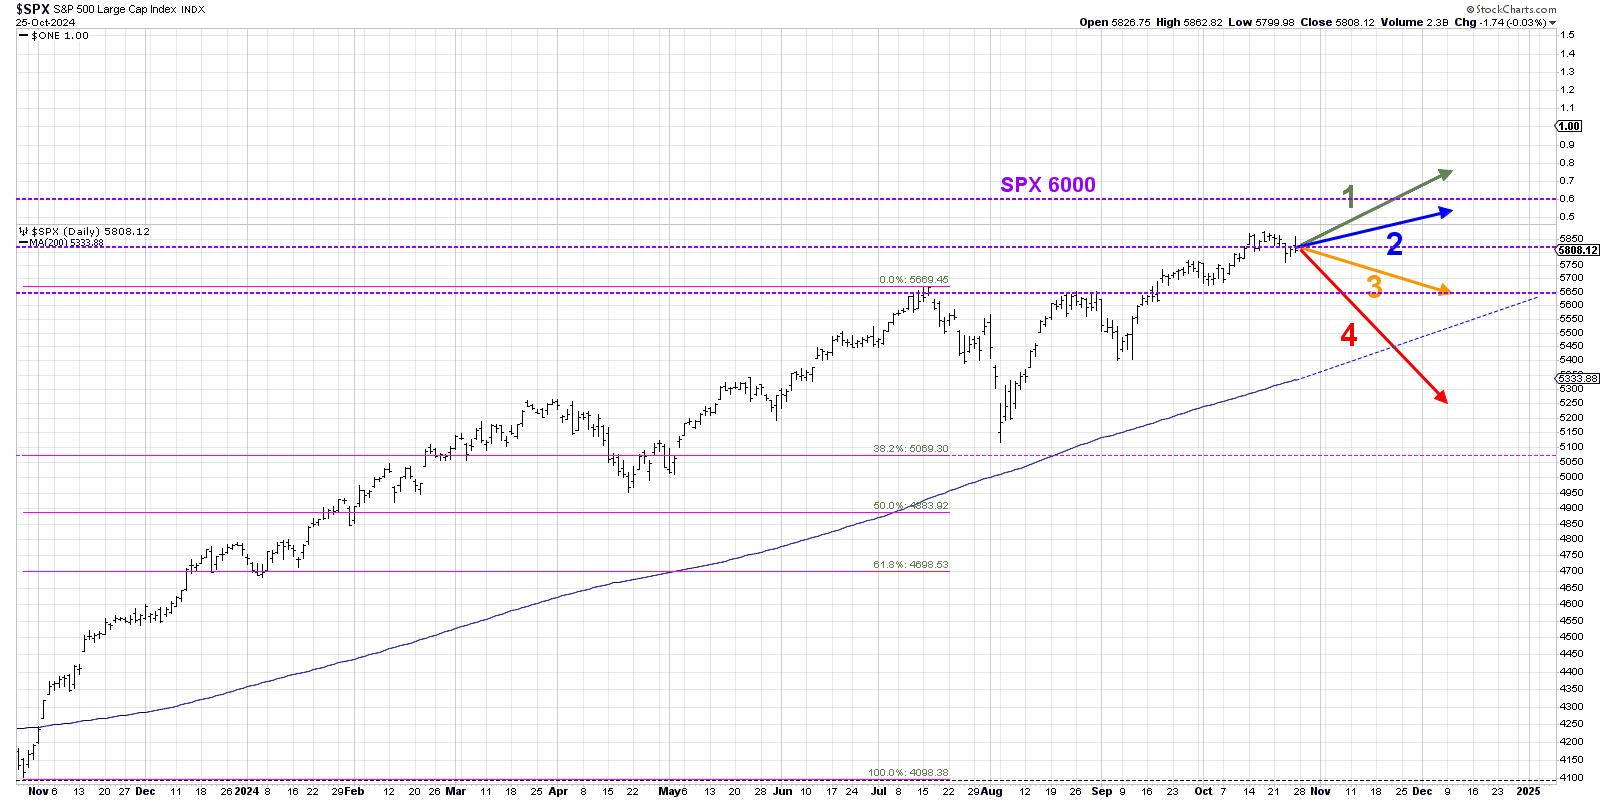
Let’s start with the most bullish scenario, where the S&P 500 keeps going with a consistent pace and breaks above 6000 by early December.
Option 1: The Super Bullish Scenario
The S&P 500 has experienced a remarkably strong run off the low in early August. This first scenario would mean a continuation of the pace of the current trend, suggesting the SPX would remain above a trendline drawn from the August and September lows. This scenario would include the S&P breaking above 6000 for the first time, and by early December, we’d be wondering how we made it through an entire calendar year with the biggest drawdown sitting at just less than 10%.
Dave’s Vote: 5%
Option 2: The Mildly Bullish Scenario
Let’s say that Trump wins a second term, and investors see that as a fairly pro-business and pro-market outcome? But at the same time, new economic data and the November Fed meeting leave investors a little skeptical of the Fed’s ability to navigate the soft landing scenario into early 2025?
The second scenario would mean we drift a bit higher, but breadth conditions break down as investors gravitate to Magnificent 7 stocks and other safe havens as the VIX pushes above 20. We don’t see a major correction into early December, but it still feels like one is just around the corner and everyone’s talking about overvaluations and a potential Q1 pullback.
Dave’s vote: 25%
Option 3: The Mildly Bearish Scenario
A Harris victory could certainly weigh on the markets as we progress through Q4, as we realize how much investors had been pricing in a Republican White House. Skepticism of the Fed reaches a fever pitch as we’re no longer talking about a potential soft landing, but rather when the next major correction will play out. Volume and breadth divergences that have been growing in October continue to play out, and a 2018-style Q4 drop becomes our reality in 2024.
Dave’s vote: 50%
Option 4: The Very Bearish Scenario
You always need a “doomsday” scenario, where things get bad and stay bad. What if the S&P 500 starts selling off as a frustrating earnings season leads into a contentious election and a November Fed meeting raises more questions than answers? Paul Tudor Jones famously remarked, “Nothing good happens below the 200-day moving average.” And in this scenario, that’s exactly what we’re facing in December as we wonder where how and why the normal Q4 rally is nowhere to be seen.
Dave’s vote: 20%
What probabilities would you assign to each of these four scenarios? Check out the video below, and then drop a comment with which scenario you select and why!
RR#6,
Dave
PS- Ready to upgrade your investment process? Check out my free behavioral investing course!
David Keller, CMT
Chief Market Strategist
StockCharts.com
Disclaimer: This blog is for educational purposes only and should not be construed as financial advice. The ideas and strategies should never be used without first assessing your own personal and financial situation, or without consulting a financial professional.
The author does not have a position in mentioned securities at the time of publication. Any opinions expressed herein are solely those of the author and do not in any way represent the views or opinions of any other person or entity.